Let’s say you’re teaching a Grade 8 or Freshman level class. Algebra 1-ish. You’ve got some data here.

x y
1 3
2 5
4 10
6 10
8 12
10 17

You want to show how data may be modeled as an equation. We could go about this two ways.

We could follow some TI-84 instructions via a handy dandy set of instructions.

We could also do something like this in Desmos, using the sliders feature.
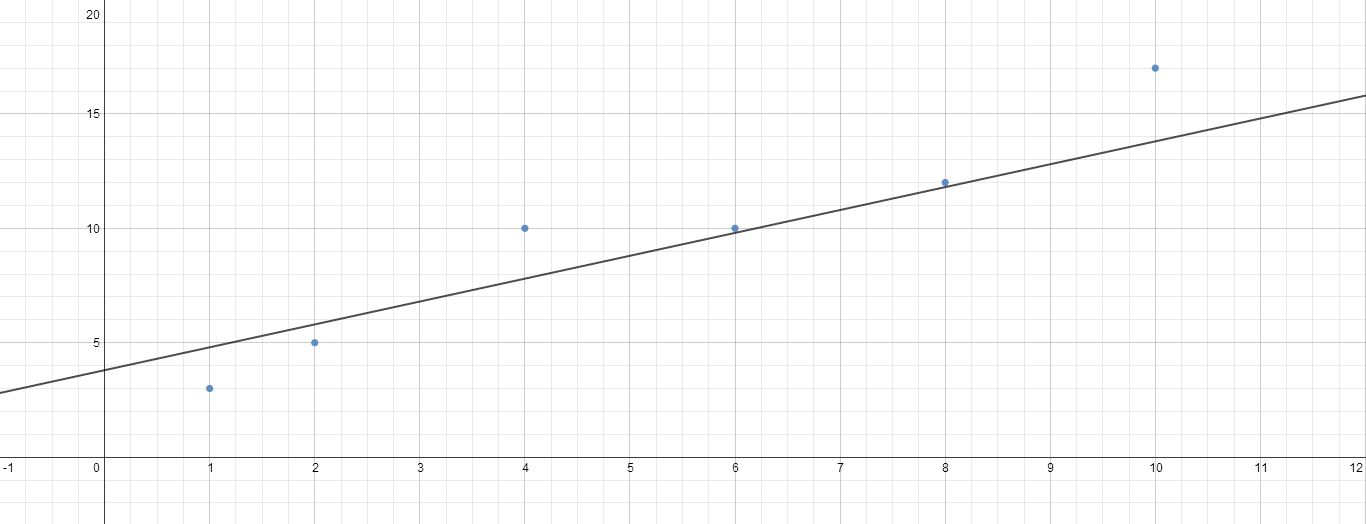
Students would be asked to manipulate the sliders until they think they have the line of best fit.

Discussion questions:

  • Which of these activities leads to the more accurate answer?
  • Which of these develops a better understanding of how a data set may be represented by an equation?

I wouldn’t say that conceptual understanding and accuracy are always juxtaposed, but it seems that they sure can be. I think I’ll leave it at that for now, but I’m a bit terrified to pursue this line of thinking much further. There might be drastic implications that I’m not sure I’m emotionally ready to handle right now.

11 thoughts on “Accuracy vs. Understanding

  1. The question, I think, is whether they would understand what the calculator is *doing* in the first example. In other words, they can play with the lines for a while, maybe even a semester; but eventually they may want (or need) a more accurate equation (and hence, a more accurate prediction – or whatever you’re using the model for), at which point they should go ahead and use the calculator. I would…but I also know what’s going on.
    As long as you’re not having them make a “wild-ass guess”, I think you’re okay.

    1. That makes sense to me, Jeff. Although I’d ask the question: why bother with the calculator at all? If you’re looking for accuracy you can use a spreadsheet program. I’m just not sure what the step-by-step button worksheet actually teaches. I don’t even think it teaches well what it purports to.

      1. It doesn’t teach a thing. If I wanted to know how to create a scatterplot in a TI-84 (which I don’t know how to do), this would walk me through it. In other words, if a student asked me how to do it on that particular calculator in order to help solve their problem, I’d point them to this. But having the class do it wholesale…I see no point.

  2. I love this. Why on earth should 8th graders worry about the perfect line of best fit? (And I’m still not sure why/if the procedure used gives the true best fit. What it does is minimize the sum of the *squares* of the errors – mainly because calculus can’t handle minimizing the sum of the absolute value of the errors.) Finding the best line visually seems much more interesting.

  3. And you could do some stats on how much variation there was in different students’ answers. That sounds interesting, too.

  4. I would expect that the Desmos approach has a better chance of leading to understanding. However, what is it that the students walk away with as an understanding? Are you looking for an understanding of the statistical concept of “fit”, or of the role each parameter in a linear equation plays, or both?

    If you wish them to understand linear equation parameters, have they really thought about why one parameter has a very different effect than the other? Can they apply that understanding in a different context? My one public attempt at conveying such an understanding is here, but it probably does not work for every student or all age groups: http://mathmaine.wordpress.com/2010/01/19/overview-linear-equ-graphs/

    If you wish them to understand the concept of “fit”, how do they justify and quantify their definition of “fit”. An assessment of an answer’s accuracy will depend on what their “fit” goal was… I would not seek to assess their definitions, but instead would turn them into fodder for group discussions: compare definitions of best fit within your group, and see if you can arrive at a consensus definition. Then compare what the groups came up with as a whole class, ask them to think about it overnight, and then present the pros and cons of each definition next class. There is no “right answer” you are seeking, rather you are asking them to “think through” their position, compare/contrast it with others, and then either change their mind or defend their position. Celebrate the insightful analyses that demonstrate understanding of the flaws and advantages to an approach. Then perhaps propose another approach to “fit”, one which has not been proposed in the class, and ask all to analyze its pros and cons. Not only will they understand the concept of “fit” much better, but they will have learned much about analyzing and defending a position.

    1. Just a google search of “How to find a line of best fit TI-84” does the trick.

      Side note: we once had kids MEMORIZE the button sequence of how to clear the calculator memory (i.e. [2nd]–>[Mem]–> etc. etc.. Because we didn’t trust them enough to navigate the button labels and menu options, apparently.

  5. IMHO, the only time you should hand out the procedure list such as the first example is reviewing for a test/exam where students are expected to perform a linear regression.

    I’ve done something similar to the desmos demonstration on the 83/84 – one nice thing is that kids can graph a few different lines at the same time. I think that makes it easier to evaluate which is “best” rather than trying to remember what the last version looked like.

Leave a Reply

Fill in your details below or click an icon to log in:

WordPress.com Logo

You are commenting using your WordPress.com account. Log Out /  Change )

Twitter picture

You are commenting using your Twitter account. Log Out /  Change )

Facebook photo

You are commenting using your Facebook account. Log Out /  Change )

Connecting to %s