I have had the pleasure of “facilitating” Elementary PBL sessions this week. I placed “facilitating” in quotes because I’m essentially window dressing while the venerable Stacey Lopaz, Jodi Posadas, and Megan Pacheco do the actual facilitation. My knowledge base of Elementary PBL is probably lower than the median participant. Even in just a day I’ve had several takeaways.
I am a tree.
Stacey led us through an activity called “I am a tree.” It goes like this:
- The first person says “I am a tree” and then the person poses as a tree.
- The second person thinks up something to add to the scene and poses like that. In our scene, Jodi posed as and said “I am a nest” and made a nice little nest handshape.
- The next person adds on: “I am a leaf on the tree.”
- The last person adds on: “I am the grass under the tree.”
- The first three are dismissed and we start again with the last person – the grass – and create another scene: “I am a chicken eating the grass”, ”I am the hen house”, etc.
The idea is to practice building on one another’s ideas. Or using existing ideas and more fully develop them. Either way it was fun, and I feel like it’s what we do here on the ol’ Internet.
I am a tree: I threw out this potential entry event.
I am a nest: Dane made it more interesting and more fully fleshed out.
I’d like to tree/nest one the first non-tree activity we partook of.
I am a tree: Stacey and Jodi passed out unlabeled contour maps of Chicago by year.

Participants talked about what they thought it represented. Guesses were made (“hotels”, “ozone”, “population”, etc.). Analysis occurred. We did a Notice/Wonder protocol about the maps.
There was so much for a math teacher to take away. The curiosity was initiated via the unidentified maps. We got some guesses on the board before the answer was revealed.
I am a nest: I’m not the first to suggest that guessing is good. The unlegened map could be a great way to get students oriented to the idea of using their intuition and estimation abilities.
I began to think about how could I translate this experience to other math content. Such as,
Given the x-axis and the trend, what do you think the y-axis is?

Given the axes, what do you think the trend will look like?

(Note: this reminds me of that really cool NY Times activity from a couple months ago, predicting the trendline of family income and college attendance.)
OR
What do you Notice and Wonder about the following data?
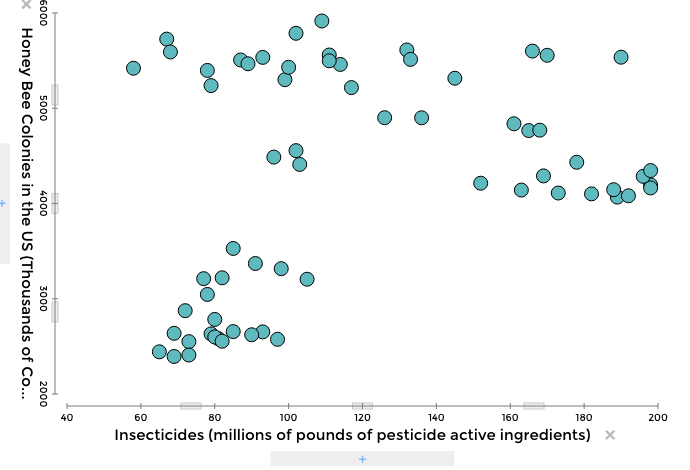
(all data and graphs are from Tuvalabs)
Elementary teachers often have a sensibility that a lot of math teachers could learn from. In our session today, our facilitators channeled our energy in a way that allowed us to practice a norm and initiated curiosity using visual prompts. I’m curious if you’re able to take away things from sessions that don’t necessarily fit your exact context. Because I feel like that happens all the time when I participate in Elementary conference sessions.
